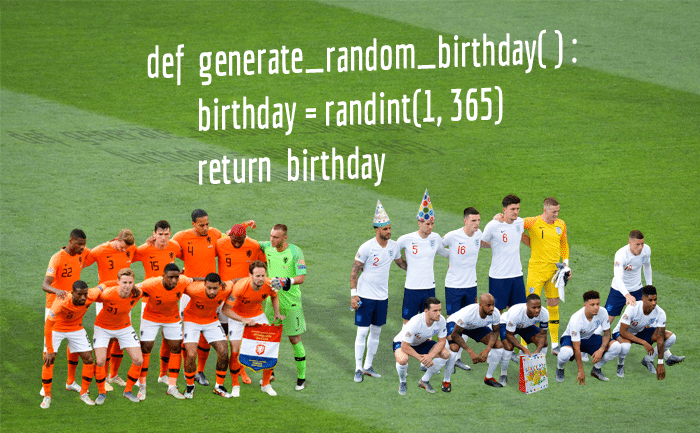
In my last post, I introduced you to the so-called birthday problem. Namely, the probability of having at least one birthday coincidence in a random group of people. I showed you how to approach the question analytically by deriving a simple formula for calculating this probability.
In this post, I want to show you an alternative way of getting the same probability using a computer simulation with the programming language Python!
This post is part of my series Probability Questions from the Real World.
If you haven’t already, I recommend first going through this introductory post. It gives a good overview of the role of computer simulations in estimating probabilities empirically. Also, if you’re completely new to Python or programming in general, you’ll find instructions on how to install Python and run the code I’m about to show you.
If you intend to run the code, it’s better to get a Python interpreter ready. If you don’t have one, as I recommended in the introductory post, just download and install Anaconda. Then you can start Jupyter Notebook and create a new Python file to copy/paste and run the code I’m about to show you.
A recap of the birthday problem
As a reminder, here’s the problem taken from Henk Tijms’ book Understanding Probability:
“You go with a friend to a football (soccer) game. The game involves 22 players of the two teams and one referee. Your friend wagers that, among these 23 persons on the field, at least two people will have birthdays on the same day. You will receive ten dollars from your friend if this is not the case. How much money should you, if the wager is to be a fair one, pay out to your friend if he is right?”
In order to figure out this fair amount, we came up with a simple equality between the expected values of you and your friend. Besides the amount itself, there were two additional unknown values — the probabilities of “At Least One Coincidence” (ALOC) and “No Coincidences” (NC). But these two unknowns actually boil down to a single unknown, due to the relationship between them (ALOC and NC are complementary events):
We derived the following general formula for calculating P(ALOC) for any number of people k:
And for
The goal of this post is to show you an alternative way of obtaining (approximating) these probabilities empirically, with the help of a computer simulation.
Table of Contents
Simulating the birthday problem
Like I said in the introductory post, empirically estimating probabilities of outcomes involves repeating the process that leads to the outcomes a large number of times. Then, using the law of large numbers, we estimate the probability of an outcome as:
That is, the number of trials in which the outcome has occurred divided by the total number of trials.
Approximating the birthday coincidence probability with this approach basically involves taking random 23-people samples from the population and counting how many of them have at least one birthday coincidence. Then you simply divide this number by the total number of samples and this is (approximately) the probability of the “At Least One Coincidence” outcome.
But since actually obtaining random samples of birthdays is quite difficult and time-consuming, we want to simulate this process on a computer with the simplifying assumptions from the original birthday problem. Namely:
- The birthdays are independent of each other
- Each possible birthday has the same probability
- There are only 365 possible birthdays (not 366, since we’re ignoring leap years)
In other words, we’re modeling the process as drawing 23 independent samples from a discrete uniform distribution with parameter .
The simulation steps
In a nutshell, here is what our simulation should do:
- Generate a list of 23 random numbers between 1 and 365 (representing the 365 possible birthdays of the 23 people)
- Check if the list contains any coincidences or all 23 numbers are different
- Repeat these two steps N number of times and keep track of the number of lists with at least one coincidence (C)
- Estimate P(ALOC) as
All we need to do is give a computer these instructions but computers don’t understand natural languages like English very well (yet). So we need to give them in a language that they do understand. Namely, a programming language like Python! Now let’s see how we can do this.
I’m first going to show you the entire code and then I’m going to go through the individual parts and briefly explain what they do. I won’t go into too much detail about the programming concepts themselves. But even if you’re completely new to programming, I encourage you to stay with me and try to run the code anyway. If you hit any issues, just ask in the comment section.
Python code for the birthday problem
To keep the code clean, we’re going to wrap pieces of code into meaningful functions which we can reuse. Functions in Python (and generally in programming) are very similar to mathematical functions. Every function returns some output value based on an input value it gets. Well, a notable difference is that inputs and outputs are optional in Python functions (unlike in mathematical functions) but let’s leave this technical detail aside for now.
Anyway, here’s the entire code for calculating the probability of at least one birthday coincidence in a group of 23 people:
from random import randint


NUM_PEOPLE = 23
NUM_POSSIBLE_BIRTHDAYS = 365
NUM_TRIALS = 10000


def generate_random_birthday():
    birthday = randint(1, NUM_POSSIBLE_BIRTHDAYS)
    return birthday


def generate_k_birthdays(k):
    birthdays = [generate_random_birthday() for _ in range(k)]
    return birthdays


def aloc(birthdays):
    unique_birthdays = set(birthdays)

    num_birthdays = len(birthdays)
    num_unique_birthdays = len(unique_birthdays)
    has_coincidence = (num_birthdays != num_unique_birthdays)

    return has_coincidence


def estimate_p_aloc():
    num_aloc = 0
    for _ in range(NUM_TRIALS):
        birthdays = generate_k_birthdays(NUM_PEOPLE)
        has_coincidence = aloc(birthdays)
        if has_coincidence:
            num_aloc += 1

    p_aloc = num_aloc / NUM_TRIALS
    return p_aloc


p_aloc = estimate_p_aloc()
print(f"Estimated P(ALOC) after {NUM_TRIALS} trials: {p_aloc}")
In the first line, we’re importing the function randint from Python’s standard library and in the next few lines we’re defining a few constants. The convention in Python is to define constants with all capital letters.
Then, between lines 9 and 38 we’re defining four functions that perform different steps of the simulations.
Finally, in line 41 we’re calling the estimate_p_aloc function to estimate the probability of at least one coincidence. We store its return value in the variable p_aloc and display it as the result of the simulation with the in-built print function.
This isn’t necessarily the shortest or most efficient way of writing this simulation. But here the goal is to learn, not to optimize, so I think it’s better to keep the code more explicit.
By the way, notice the text indentations in the code? In many programming languages those are optional and people use them to make the code more readable. However, in Python indentations actually have meaning and are interpreted.
Now let’s build this code from scratch.
Generating random birthdays (step 1)
I’m going to break this section in two parts. In the first, we’re going to define a function for generating a single random birthday. And in the second, we’re going to create another function which uses the first and generates an arbitrary number of random birthdays. Think of it as a more general solution to the birthday problem.
Generating a single random birthday
First, we define two constants that represent the parameters of the birthday problem. Namely, the number of possible birthdays and the number of people in the sample:
NUM_PEOPLE = 23
NUM_POSSIBLE_BIRTHDAYS = 365
Python’s standard library has a convenient module called random which has many functions for generating different kinds of random numbers. In particular, the randint function is used for generating random integers from a uniform distribution. It expects two inputs which are the lower and upper boundaries of the range from which the integer is chosen. In our case, those are 1 and 365 (stored in the constant NUM_POSSIBLE_BIRTHDAYS). To generate a random birthday, we simply call the function with those two inputs and assign its output to the variable random_birthday:
from random import randint

random_birthday = randint(1, NUM_POSSIBLE_BIRTHDAYS)
For convenience and readability, we can wrap the generation of a random birthday in a function called generate_random_birthday. The Python syntax for defining a function starts with the keyword def and looks like this:
def generate_random_birthday():
    birthday = randint(1, NUM_POSSIBLE_BIRTHDAYS)
    return birthday
Now we can call this function in other parts of the code, whenever we need to generate a random birthday.
Generating multiple random birthdays
Let’s first create an empty list in which we’re going to store these birthdays. In Python, you define an empty list with empty square brackets:
birthdays = []
And now we need to fill it with random birthdays using Python for loops. Generally speaking, in Python you use for loops whenever you need to perform the same step multiple times. The syntax looks like this:
for _ in range(NUM_PEOPLE):
    random_birthday = generate_random_birthday()
    birthdays.append(random_birthday)
The range function is a built-in Python function that generates a range with the first k natural numbers (0, 1, …, k – 1). The above code simply performs the following steps 23 times (because NUM_PEOPLE = 23):
- Generate a random number between 1 and 365
- Add it to the birthdays list (using Python lists’ append method)
Python also has a concept called list comprehensions which allows you to create lists generated by for loops in a single line:
birthdays = [generate_random_birthday() for _ in range(NUM_PEOPLE)]
Since this is shorter and more elegant, let’s use it instead of the for loop. Finally, let’s also wrap this logic in a function called generate_k_birthdays:
def generate_k_birthdays(k):
    birthdays = [generate_random_birthday() for _ in range(k)]
    return birthdays
Unlike the previous function, this one expects a single input parameter k specifying the number of random birthdays to generate. And now we can call this function anytime we want. When we pass 23 to it, it will generate 23 random birthdays. But we already hold the number 23 in the constant NUM_PEOPLE, so we can simply do:
birthdays = generate_k_birthdays(NUM_PEOPLE)
Checking if a list of birthdays has coincidences (step 2)
Now that we have the code that generates lists of 23 random birthdays on demand, we need to write some other code that checks if a list has any coincidences or all birthdays are unique. For that, we’re going to use two built-in Python functions: set and len.
The set function takes a Python list-like object and turns it into a set. Like sets in mathematics, Python sets cannot contain duplicate values. Therefore, turning a list into a set basically serves to remove any existing duplicates. For example, if you pass the list [3, 5, 3, 7, 1, 7, 7] to the set function, it will return {3, 5, 7, 1}.
So, let’s pass the birthdays list to set and assign the result to a variable called unique_birthdays:
birthdays = generate_k_birthdays(NUM_PEOPLE)
unique_birthdays = set(birthdays)
So far, so good.
The len function takes an object like a list or a set and simply returns the number of elements it has. Since the birthdays list contains 23 values, we know that len(birthdays) will return 23. On the other hand, len(unique_birthdays) will return 23 only if there were no coincidences in birthdays (otherwise, it will return a lower number). Let’s assign these two return values to the variables num_birthdays and num_unique_birthdays, respectively:
num_birthdays = len(birthdays)
num_unique_birthdays = len(unique_birthdays)
Finally, let’s check if the two variables are equal to each other with the boolean operator != (“not equal to”) and assign the result to the variable has_coincidence:
has_coincidence = (num_birthdays != num_unique_birthdays)
The != operator returns the value True if the two variables are not equal, and False if they are. Therefore, the variable has_coincidence will be True only if there are less unique birthdays than birthdays (which would imply some duplicates were dropped).
The only thing left to do is wrap this logic in a function. Let’s call it aloc and make it take a birthdays list as an input parameter:
def aloc(birthdays):
    unique_birthdays = set(birthdays)

    num_birthdays = len(birthdays)
    num_unique_birthdays = len(unique_birthdays)
    has_coincidence = (num_birthdays != num_unique_birthdays)

    return has_coincidence
And this concludes step 2.
Performing multiple trials (step 3)
So far, we have the generate_k_birthdays function which returns a list of k random birthdays, as well as the aloc function which checks if this list has at least one coincidence. A single simulation trial consists of one repetition of these two steps:
birthdays = generate_k_birthdays(NUM_PEOPLE)
has_coincidence = aloc(birthdays)
Now we simply need to perform multiple trials and keep track of the outcomes. Let’s start by defining a new constant that determines the number of trials. Ten thousand seems reasonable but we can always increase it if it turns out to be insufficient:
NUM_TRIALS = 10000
Now let’s define a new variable called num_aloc and set it equal to 0:
num_aloc = 0
After each trial, we’re going to add 1 to this variable if there’s at least one birthday coincidence in the list. Basically, this it tracks how many of the 10000 random birthday lists had at least one coincidence.
To check if the ALOC condition is met, we’re going to use an if statement:
if has_coincidence:
    num_aloc = num_aloc + 1
The way if statements work is, they execute the code under them only if the value following the if is True. And since aloc(birthdays) returns True only when the birthdays list has at least one coincidence, num_aloc will be incremented by 1 only when this is the case. Python also has a shorter syntax for incrementing a variable by a fixed value that looks like this:
num_aloc += 1
Now let’s write the code that actually repeats these steps. How do we do that? You guessed it, we need another for loop:
for _ in range(NUM_TRIALS):
    birthdays = generate_k_birthdays(NUM_PEOPLE)
    has_coincidence = aloc(birthdays)
    if has_coincidence:
        num_aloc += 1
With this code, the two steps will be repeated 10000 times and num_aloc will be incremented by 1 at all trials with at least one birthday coincidence.
Calculating the probability estimate (step 4)
We pretty much wrote most of the code for the birthday problem simulation. It generates multiple lists of 23 birthdays and keeps track of how many of them contain at least one coincidence. Now the only thing left to do is calculate the final probability.
Well, num_aloc is equal to the number of trials with at least one birthday coincidence and NUM_TRIALS is equal the total number of trials, right? Then we simply need to divide the former by the latter using the / operator and assign the result to a new variable called p_aloc:
p_aloc = num_aloc / NUM_TRIALS
This is it, now the p_aloc variable will be equal to our estimate of the probability! But before we run the code, let’s wrap everything we did in this and the previous step into a function called estimate_p_aloc:
def estimate_p_aloc():
    num_aloc = 0
    for _ in range(NUM_TRIALS):
        birthdays = generate_k_birthdays(NUM_PEOPLE)
        has_coincidence = aloc(birthdays)
        if has_coincidence:
            num_aloc += 1

    p_aloc = num_aloc / NUM_TRIALS
    return p_aloc
Calling this function starts the simulation and returns the estimated probability of at least one birthday coincidence. We can store the return value in the variable p_aloc and display it with the print built-in function:
p_aloc = estimate_p_aloc()
print(f"Estimated P(ALOC) after {NUM_TRIALS} trials: {p_aloc}")
After all these explanations, it will be useful to go back to the beginning and take a look at the entire 40-line code. Then you can copy/paste and run it in your own Jupyter Notebook file. Or, if you prefer, you can download and run this Jupyter Notebook file that I prepared for you.
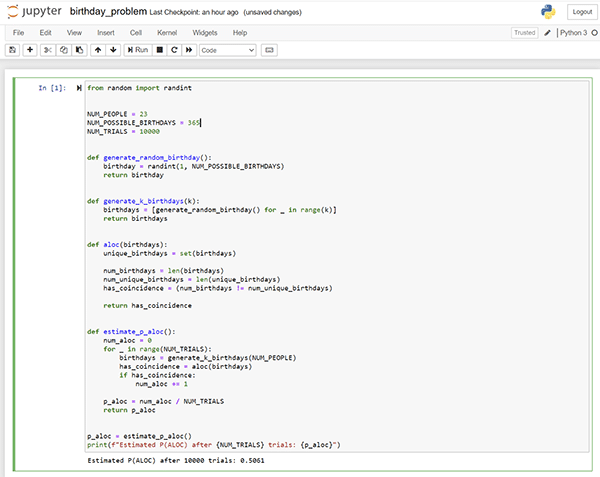
Here’s what I got when I ran the code:
After 10000 trials, the estimate for P(ALOC) is 0.5061, which is quite close to the real probability of around 0.507. Pretty neat!
Generalizing the code for arbitrary group sizes
One thing about the code above is that it only works for groups of 23 people since this value is hard-coded in the NUM_PEOPLE constant (because this was the condition in the original question). If we want to estimate P(ALOC) for other group sizes, we need to change the value of the constant and re-run the code.
But the whole point of programming is to make your life easier by automating things. So, let’s instead make a few small changes in the estimate_p_aloc function to make it automatically work for any number of people so it represents the general birthday problem formula:
Take a look at the code below where I highlighted the two modified lines:
def estimate_p_aloc(k):
    num_aloc = 0
    for _ in range(NUM_TRIALS):
        birthdays = generate_k_birthdays(k)
        has_coincidence = aloc(birthdays)
        if has_coincidence:
            num_aloc += 1

    p_aloc = num_aloc / NUM_TRIALS
    return p_aloc
Basically, instead of having no input parameter, the function now accepts the parameter k. The only difference in calling the function is that we need to pass k as an argument. For example, for 36 people we would call the function like this:
p_aloc = estimate_p_aloc(36)
What this small modification now allows us to do is estimate and store the probabilities for a whole range of numbers. For example, we can estimate the probabilities for group sizes ranging from 2 to 60. This will allow us to replicate the plot we got from the analytic solution to the birthday problem:
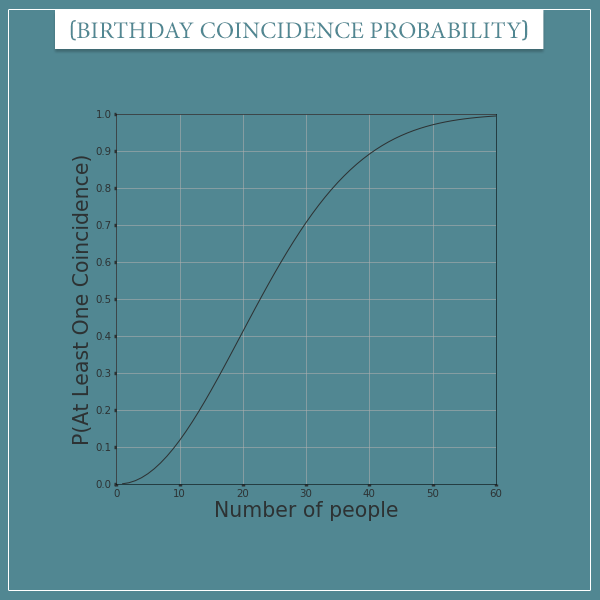
Estimating probabilities for a range of values
Let’s get rid of the NUM_PEOPLE constant and replace it with two other constant called MIN_NUM_PEOPLE and MAX_NUM_PEOPLE:
MIN_NUM_PEOPLE = 2
MAX_NUM_PEOPLE = 60
Now let’s create a range of k’s and store them in a variable called ks using the range function again:
ks = range(MIN_NUM_PEOPLE, MAX_NUM_PEOPLE + 1)
Notice that this time we’re passing two arguments to range, instead of one (Python functions can be flexible like that). If you pass a single argument n to range, it generates the numbers 0 through n – 1. But if you want the range to start from a different number than 0, you can pass it as a first argument like we did above. Notice that the second argument is MAX_NUM_PEOPLE + 1, since otherwise the last value in the range would be 60 – 1 (instead of 60).
Next, let’s create an empty list to hold the probabilities for each k:
k_probabilities = []
Now all we have to do is fill this list with the probabilities for each k. To do that, we’re going to use a for loop again to iterate over the ks range object:
for k in ks:
    p_aloc = estimate_p_aloc(k)
    k_probabilities.append(p_aloc)
Up until now, I was using _ (underscore) for the variable after the for keyword but now we’re passing k instead. Why is that? Well, what I didn’t tell you before is that, in Python for loops, this variable changes its value to the next element in the object we’re iterating over. It’s a common convention to use _ when the value isn’t used within the for loop. But this time we actually need to pass a different k to estimate_p_aloc at each iteration so we used a more descriptive name.
Let’s keep the code tidy and wrap the last part in a function:
def estimate_p_aloc_for_range(ks):
    k_probabilities = []

    for k in ks:
        p_aloc = estimate_p_aloc(k)
        k_probabilities.append(p_aloc)

    return k_probabilities
Plotting the estimated probabilities
Notice that the function accepts a single input parameter ks (the range of k’s). Then, we can simply do:
ks = range(MIN_NUM_PEOPLE, MAX_NUM_PEOPLE + 1)
k_probabilities = estimate_p_aloc_for_range(ks)
Now this small piece of code will calculate the probability estimates for all k’s from 2 to 60 and store them in the list k_probabilities. Let’s plot these probabilities in order to compare the estimates with the real probabilities. I just ran the code and here’s a plot of the k_probabilities I got:
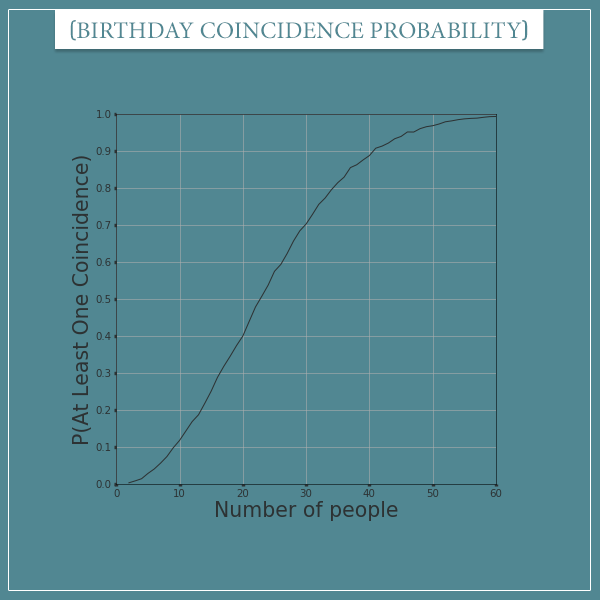
Notice how similar this plot is to the one with the actual birthday problem probabilities, even after only 10000 trials per k!
I’m going to show you the code that generates this plot with two third-party plotting libraries: Matplotlib and Seaborn. I don’t want to overwhelm you with too much explanation in this post, so I won’t go into detail here. If you try to read the code, most of it will probably make sense anyway.
import matplotlib.pyplot as plt
import seaborn as sns


fig, ax = plt.subplots(figsize=(10, 10), dpi=49)
ax.set_facecolor('#518792')
ax.xaxis.set_tick_params(width=5, color='#2d3233')
ax.yaxis.set_tick_params(width=5, color='#2d3233')

sns.lineplot(x=ks, y=k_probabilities, color='#2d3233')

plt.xticks(fontsize=15, color='#2d3233')
y_range = [0, 0.1, 0.2, 0.3, 0.4, 0.5, 0.6, 0.7, 0.8, 0.9, 1]
plt.yticks(y_range, fontsize=15, color='#2d3233')
plt.grid()
plt.xlim([0, 60])
plt.ylim([0, 1])
plt.xlabel('Number of people', fontsize=30, color='#2d3233')
plt.ylabel('P(At Least One Coincidence)', fontsize=30, color='#2d3233')

plt.show()
Why are the estimates so good?
To get some intuition about why these estimates are so accurate, let’s look at a couple of animations. The idea is to keep track of the simulation’s progress after each step. For example, here’s the evolution of our probability estimate in a group of 23 people:
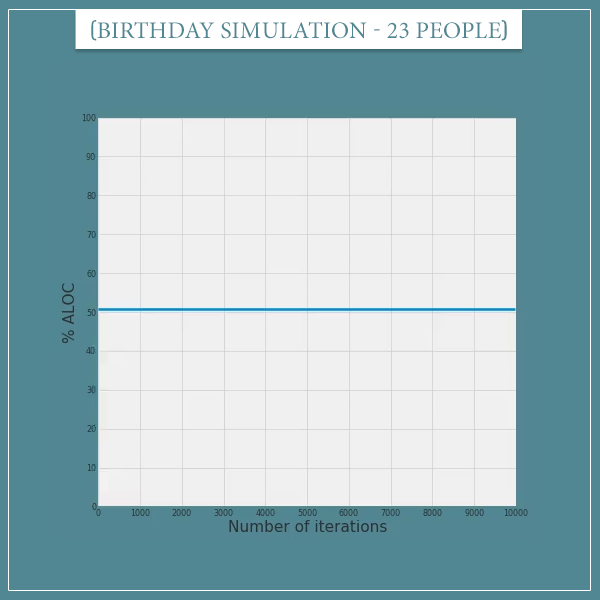
Click on the image to start/restart the animation.
Since the true probability is about 0.507, we expect 50.7% of the trials (iterations) to be of the ALOC type. Which is pretty much what the estimate is converging to.
To see that this works for other probabilities, check out another animation for 15 people. Here the true probability is very close to 0.25:
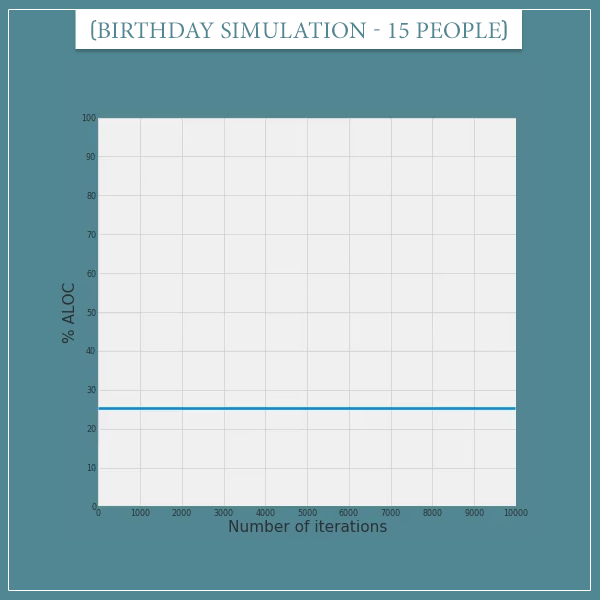
Click on the image to start/restart the animation.
Again, the percentage of ALOC trials easily converges to the expected percentage. And notice that in both simulations we don’t even need 10000 trials, since the convergence happens before the 5000th trial.
What can we say, the law of large numbers is a powerful thing!
The final code
Here’s the final code of what we did in this section, all in one place:
from random import randint

import matplotlib.pyplot as plt
import seaborn as sns


MIN_NUM_PEOPLE = 2
MAX_NUM_PEOPLE = 60
NUM_POSSIBLE_BIRTHDAYS = 365
NUM_TRIALS = 10000


def generate_random_birthday():
    birthday = randint(1, NUM_POSSIBLE_BIRTHDAYS)
    return birthday


def generate_k_birthdays(k):
    birthdays = [generate_random_birthday() for _ in range(k)]
    return birthdays


def aloc(birthdays):
    unique_birthdays = set(birthdays)

    num_birthdays = len(birthdays)
    num_unique_birthdays = len(unique_birthdays)
    has_coincidence = (num_birthdays != num_unique_birthdays)

    return has_coincidence


def estimate_p_aloc(k):
    num_aloc = 0
    for _ in range(NUM_TRIALS):
        birthdays = generate_k_birthdays(k)
        has_coincidence = aloc(birthdays)
        if has_coincidence:
            num_aloc += 1

    p_aloc = num_aloc / NUM_TRIALS
    return p_aloc


def estimate_p_aloc_for_range(ks):
    k_probabilities = []

    for k in ks:
        p_aloc = estimate_p_aloc(k)
        k_probabilities.append(p_aloc)

    return k_probabilities


ks = range(MIN_NUM_PEOPLE, MAX_NUM_PEOPLE + 1)
k_probabilities = estimate_p_aloc_for_range(ks)


fig, ax = plt.subplots(figsize=(10, 10), dpi=49)
ax.set_facecolor('#518792')
ax.xaxis.set_tick_params(width=5, color='#2d3233')
ax.yaxis.set_tick_params(width=5, color='#2d3233')

sns.lineplot(x=ks, y=k_probabilities, color='#2d3233')

plt.xticks(fontsize=15, color='#2d3233')
y_range = [0, 0.1, 0.2, 0.3, 0.4, 0.5, 0.6, 0.7, 0.8, 0.9, 1]
plt.yticks(y_range, fontsize=15, color='#2d3233')
plt.grid()
plt.xlim([0, 60])
plt.ylim([0, 1])
plt.xlabel('Number of people', fontsize=30, color='#2d3233')
plt.ylabel('P(At Least One Coincidence)', fontsize=30, color='#2d3233')

plt.show()
And here’s a Jupyter Notebook file with this code, if you don’t want to copy/paste it yourself.
Summary
In this post we created a simple computer simulation of the birthday problem with Python. All the simulation does is generate multiple lists of k random birthdays and keep track of the percentage of them that contain at least one birthday coincidence.
As building blocks of the simulation, we used three basic Python objects (lists, sets, and ranges and two flow control mechanisms (for loops and if statements). We also made use of two built-in functions (set and len), as well as the randint function from the random module. We defined a few functions ourselves that hold different parts of the simulation logic. And, as we were building the final code, we made some of those functions somewhat more general. Finally, we wrote a short piece of code for plotting the simulation results with the third-part libraries Matplotlib and Seaborn.
Here’s the first Jupyter notebook file with the code for estimating P(ALOC) for a particular k. And here’s the second file with more general code that estimates P(ALOC) for all k within a range (and plots the results).
The value of simulations
Computer simulations are a valuable tool for empirically estimating probabilities of events. For the birthday problem, we already knew the true probability from the analytic solution we got in my previous post. So, in this case, the simulation was mainly useful for intuitively validating those results. Of course, once we trust the analytic results, the exercise we did here also validates the simulation method itself.
And this method is certainly an important one. I’ve already told you that sometimes finding probabilities analytically is very difficult or even impossible. When it comes to the birthday problem, calculating the probability analytically after dropping the simplifying assumptions can be quite challenging. For example, if the birthdays don’t have a uniform distribution (as is the case in real life). But, if we know the real distribution of birthdays (say, monthly), we can estimate the probability of a birthday coincidence just as easily with another simulation.
In fact, are you up for a small challenge? Try to modify the code so that it works with different birthday distributions than the discrete uniform one. For example, you can use the monthly birthday data for your country and see if the results are too different. If you decide to give it a try but get stuck, feel free to ask questions in the comment section.
HINT: you only need to modify the generate_random_birthday function.
Anyway, I hope you found this post useful and you’re beginning to see the value of computer simulations for empirically estimating probabilities. As always, feel free to ask any questions or leave feedback in the comment section below!
hello there, I’d like python to show it to me like a table, not a plot
how can I do this??
Hi, Mohammad. I guess the easiest thing you can do is put the data (ks and k_probabilities variables) into a two dimensional numpy array or a pandas DataFrame. Then you can simply pass the variable holding the array/DataFrame to the print() function and it will show you a table.
import pandas as pd
data_table = pd.DataFrame({'k': ks, 'P(k)': k_probabilities})
print(data_table)
And if you don’t want to display the index, you can modify the second line to:
print(data_table.to_string(index=False))
Does that answer your question or are you trying to achieve something more specific?
That was very good pal, thank you <3
You’re welcome buddy, glad I could help!
How would you do this without for loops?
Truly Nice explanation!!!