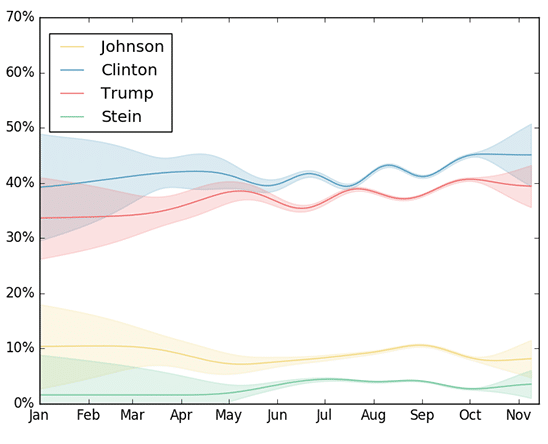
This is an update to the main post from two weeks ago. Please click on the link for a detailed description of the election process and how we model it to make the predictions you see below.
You can click on the date above the map to check the predictions for other dates. You can also click on different states on the map to see our state-specific predictions. Click here to go back to the daily predictions page.
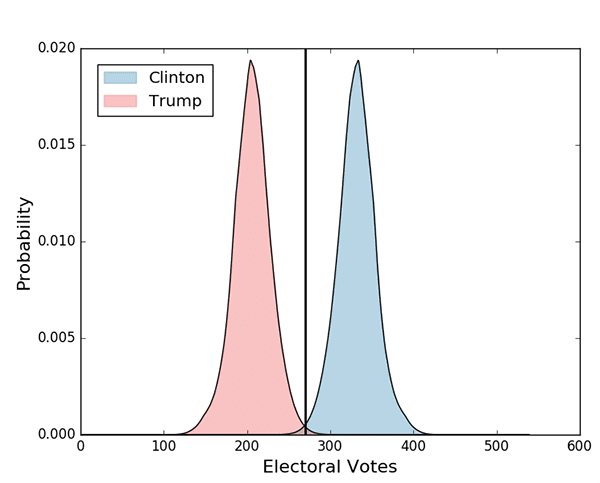
The image below shows our current estimates for the electoral vote distributions for Clinton and Trump.
As you can see, according to our model, Hillary Clinton is currently an overwhelming favorite to win the election. If you’ve been following our predictions for the past 2 weeks, you might remember that the big shift happened after the first debate from last week.
We are currently preparing a very interesting plot that is going to show the evolution of candidate win probabilities in time. Stay tuned!


Leave a Reply